Landon Melesky / gis
GIS · REMOTE SENSING · MACHINE LEARNING · GEOAI

I turn satellite and drone imagery into measurements people can check.

M.S. student in Geography at Texas A&M University (expected May 2028). I build open, reproducible workflows: from raw imagery to calibrated reflectance, from pixels to statistics with honest accuracy assessment, and from data to AI assistants that cite their sources.

3GeoAI projects: an MCP server, a foundation model and Segment Anything
3Esri training certificates
62students taught in three geodatabase lab sections
10open-source projects, each built only from public data

Projects

Each project runs end to end from public data, states what it covers and what it leaves out, and reports its accuracy, not just its maps.

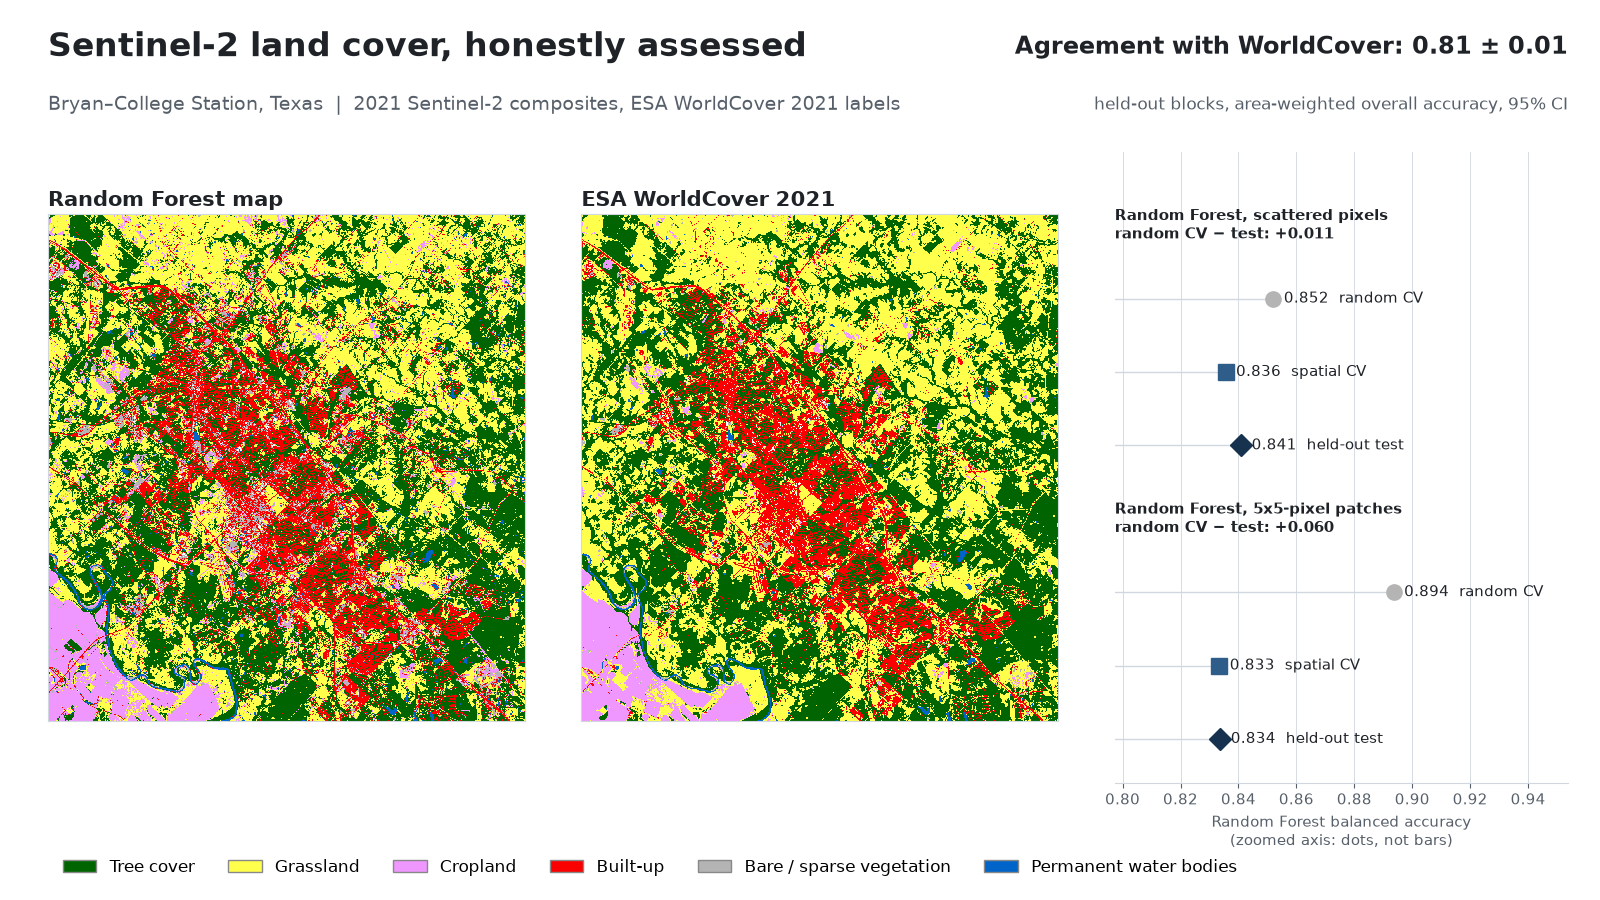
Sentinel-2 land-cover classification of Bryan–College Station, Texas, next to ESA WorldCover.
scikit-learnSentinel-2STACaccuracy assessment

Land cover with honest accuracy

Random-forest land-cover classification of Bryan–College Station from Sentinel-2, showing how random cross-validation overstates accuracy compared with spatial block validation, with area estimates and 95% intervals (Olofsson et al. 2014).

Held-out agreement with ESA WorldCover: 0.81 ± 0.015 (area-weighted, 95% CI). With polygon-like training patches, random cross-validation scored 0.89 balanced accuracy but held-out blocks only 0.83; all six area estimates' 95% intervals contained the reference area.
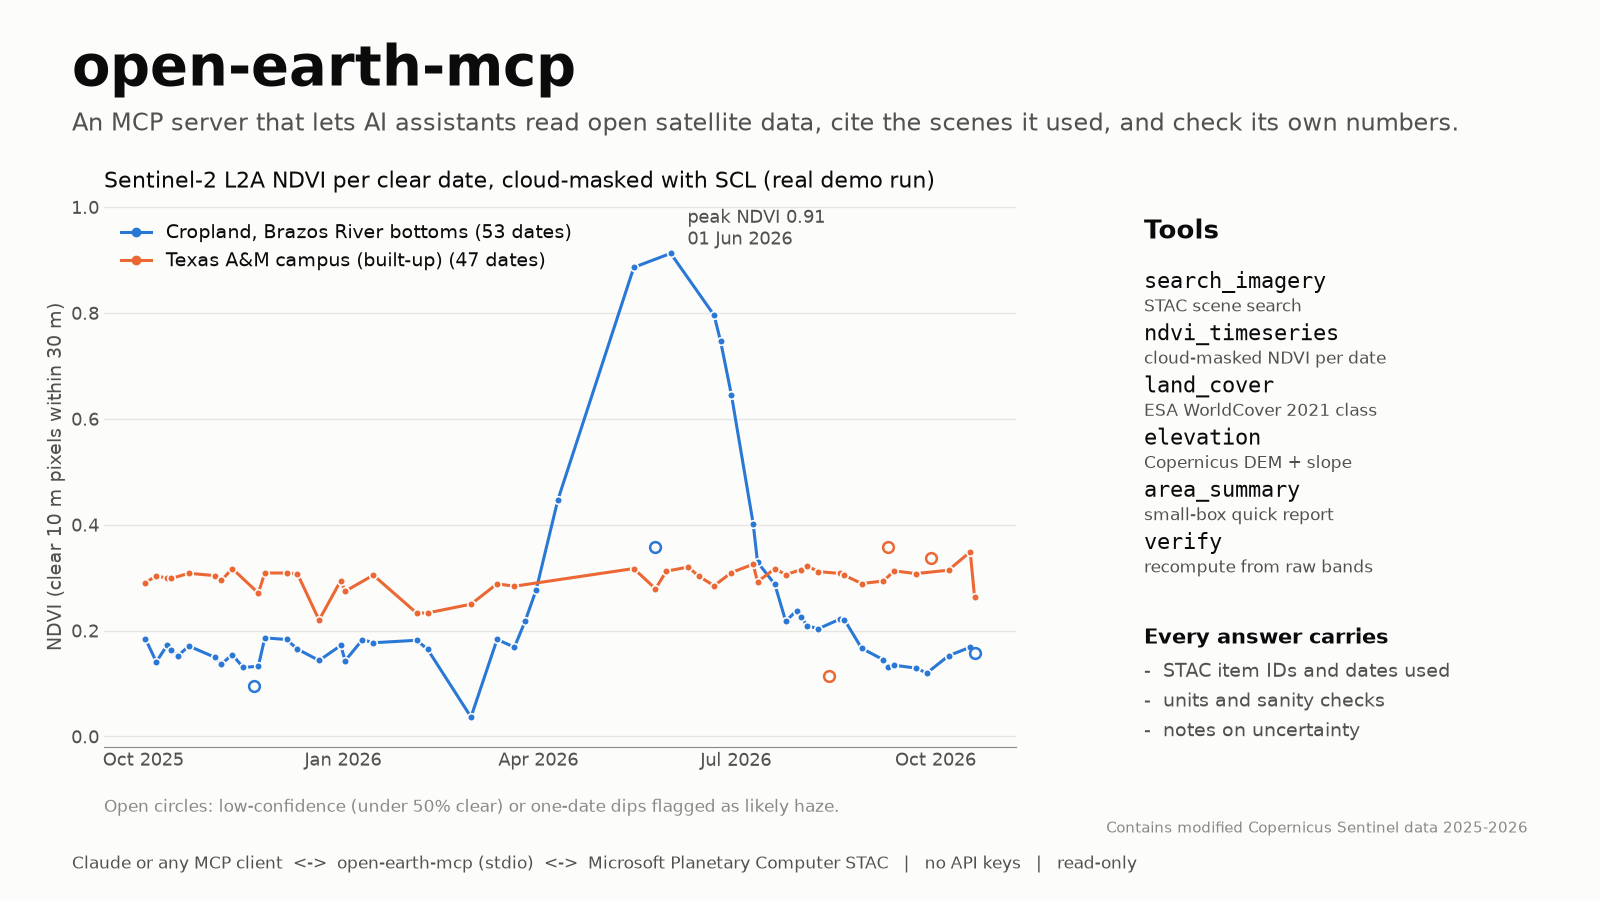
Open Earth MCP: tools an AI assistant can call for imagery, NDVI, land cover and elevation.
MCPGeoAIPythonPlanetary Computer

Open Earth MCP server

A Model Context Protocol server that lets Claude or any MCP client look up open Earth-observation data (Sentinel-2 NDVI time series, land cover, elevation) and returns the source scenes and dates with every answer, plus a verify check.

Six tools, one resource and one prompt; 29 offline tests plus a live test. Its verify tool recomputes NDVI from the raw bands by a second code path: 0.1685 vs 0.1683 on a Brazos River cropland field whose 2026 season it traced from 0.18 in March to a 0.91 peak in June.

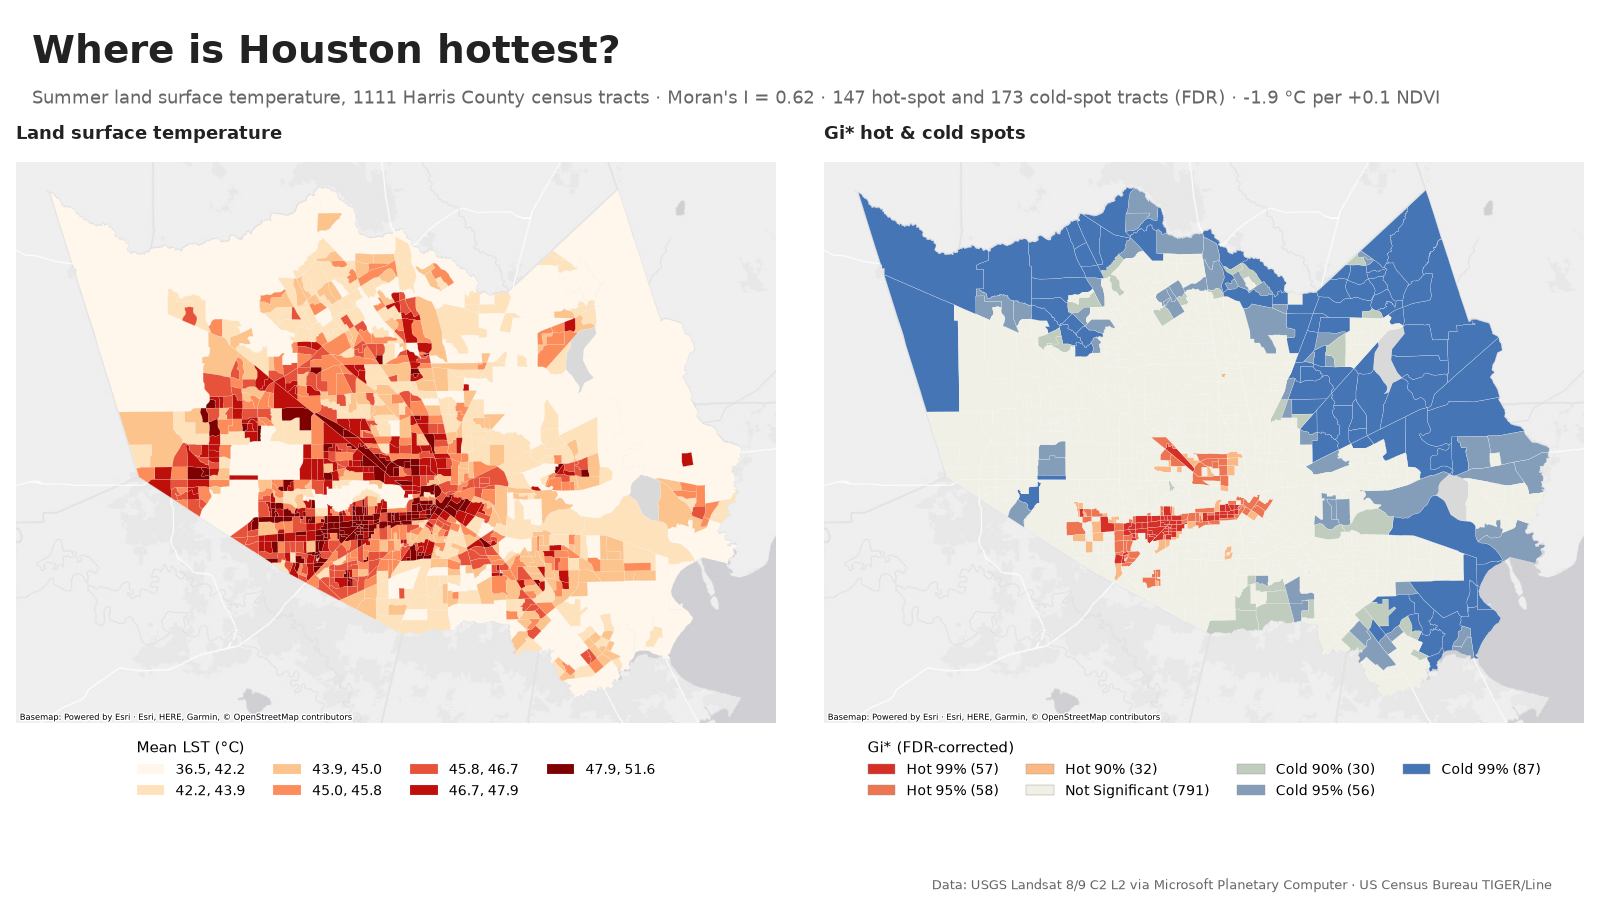
Houston urban heat: Getis-Ord Gi* hot and cold spots of land surface temperature by census tract.
PySALLandsat LSTspatial regressionCensus

Houston heat hot spots

Where is Harris County hottest in summer, and how much does vegetation explain? Landsat land surface temperature by census tract, Getis-Ord Gi* and LISA clusters, and a spatial regression that accounts for neighbors.

Summer surface temperature is strongly clustered across 1,111 tracts (Moran's I 0.62). After accounting for neighbors, each +0.1 in tract NDVI is associated with about 1.9 °C lower surface temperature (an association, not a causal effect); 147 tracts are significant hot spots after false-discovery correction.

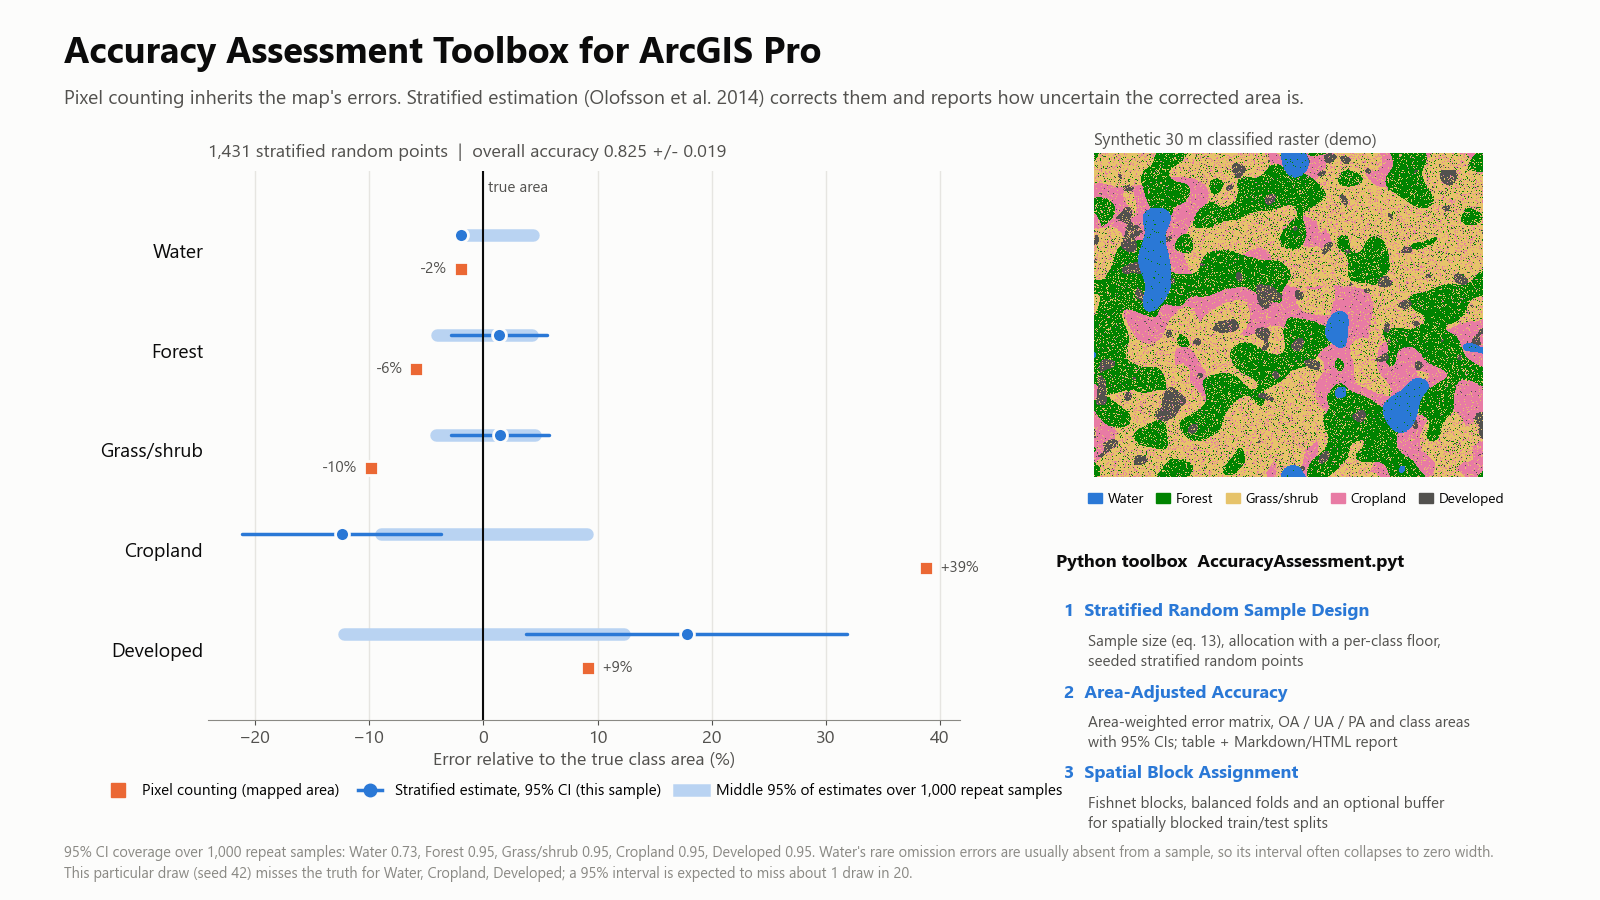
Accuracy Assessment Toolbox for ArcGIS Pro: area estimates with 95% confidence intervals compared with pixel counting.
ArcGIS ProArcPyPython toolboxstandards

Accuracy Assessment Toolbox for ArcGIS Pro

A Python toolbox that adds what Compute Confusion Matrix leaves out: stratified sample design, area-adjusted accuracy with 95% confidence intervals (Olofsson et al. 2014, with an optional Wilson interval), and buffered spatial blocks for train/test splits. Tested inside ArcGIS Pro 3.7.

Reproduces the class areas in Olofsson et al.'s worked example to the hectare. In a synthetic demo, pixel counting overstated cropland by 39%; over 1,000 repeat samples the 95% intervals covered the true area 95% of the time for four of five classes, and the report flags the one that fell short.

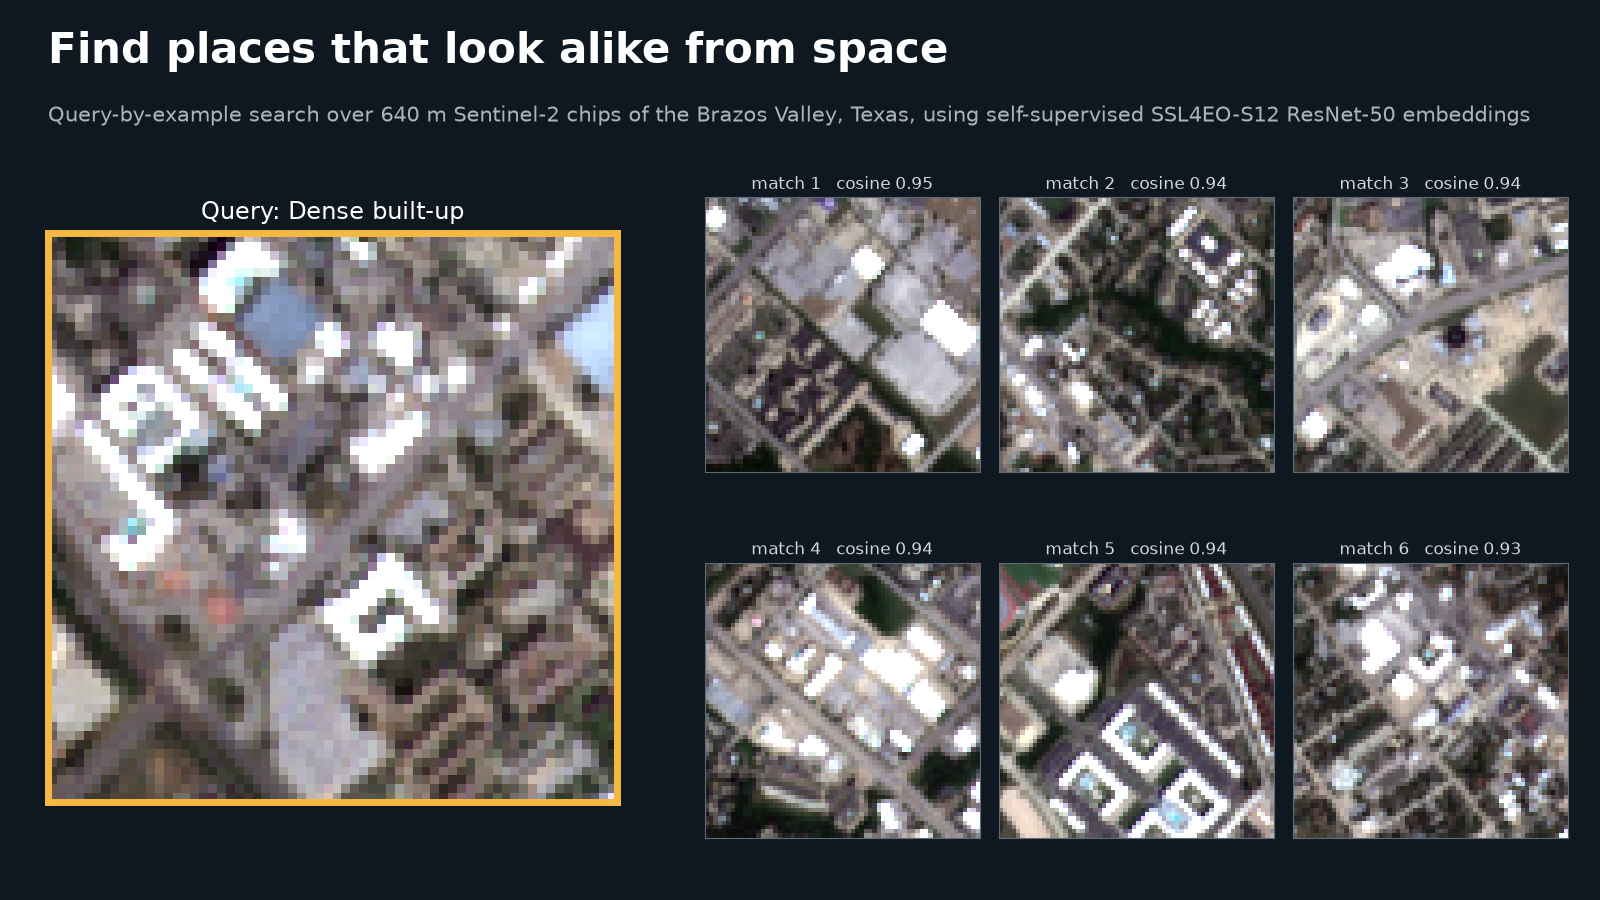
Query-by-example search: one Sentinel-2 image chip and the most similar chips found with a self-supervised foundation model.
PyTorchTorchGeofoundation modelGPU

Find places that look alike

Query-by-example search over Sentinel-2 imagery with a self-supervised foundation model (SSL4EO-S12): pick one place and retrieve the places that look most like it, then measure how often the matches share its land cover against a spectral baseline.

Over 7,974 chips of the Brazos Valley, the foundation model and a simple spectral baseline scored about the same on coarse land-cover classes (class-balanced precision@10 0.85 vs 0.83); the model's edge was on rare classes such as water (0.87 vs 0.78).

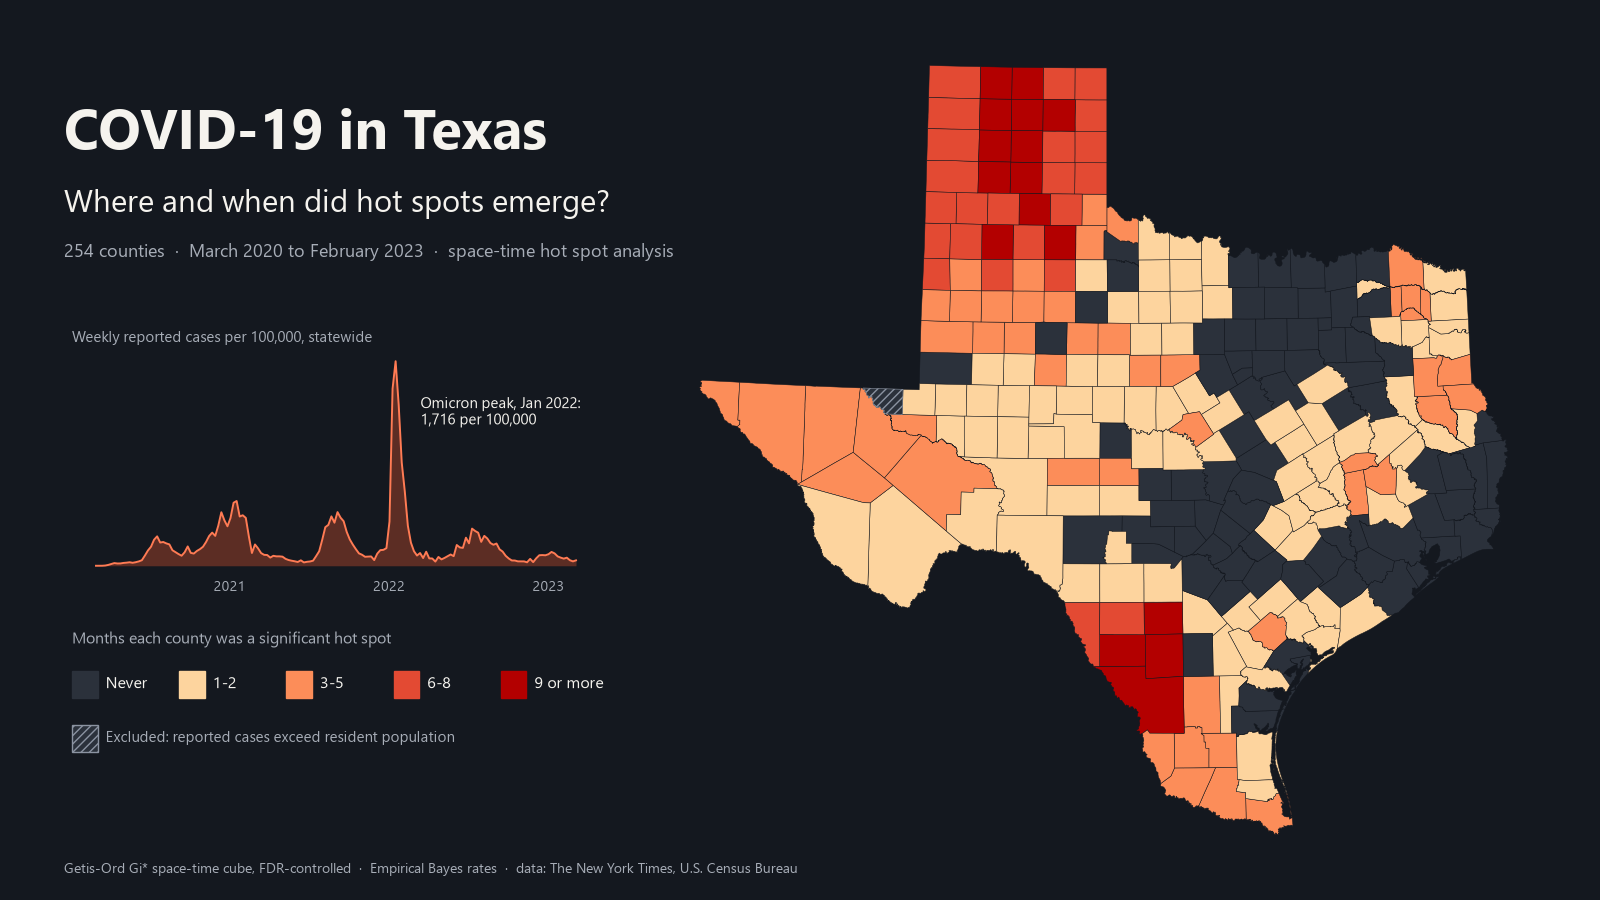
COVID-19 in Texas: map of how many months each county was a significant space-time hot spot, March 2020 to February 2023, beside the statewide weekly case curve.
space-time analysisPySALweb mappublic health

COVID-19 in Texas: where hot spots emerged

Weekly case and death rates for all 254 Texas counties, March 2020 to February 2023, smoothed for small populations (Empirical Bayes), with Getis-Ord Gi* by wave, a space-time hot spot analysis with Mann-Kendall trends, and an interactive map with a monthly time slider.

174 of 253 analyzed counties were a significant hot spot in at least one month, peaking at 76 in December 2020; in the Omicron waves hot spots returned to South Texas. One county whose reported cases exceeded its population (likely non-resident workers) is excluded, with a sensitivity run that keeps it. Nonmetro counties had a higher death rate than metro counties in every wave (538 vs 294 per 100,000 overall, not age-adjusted).

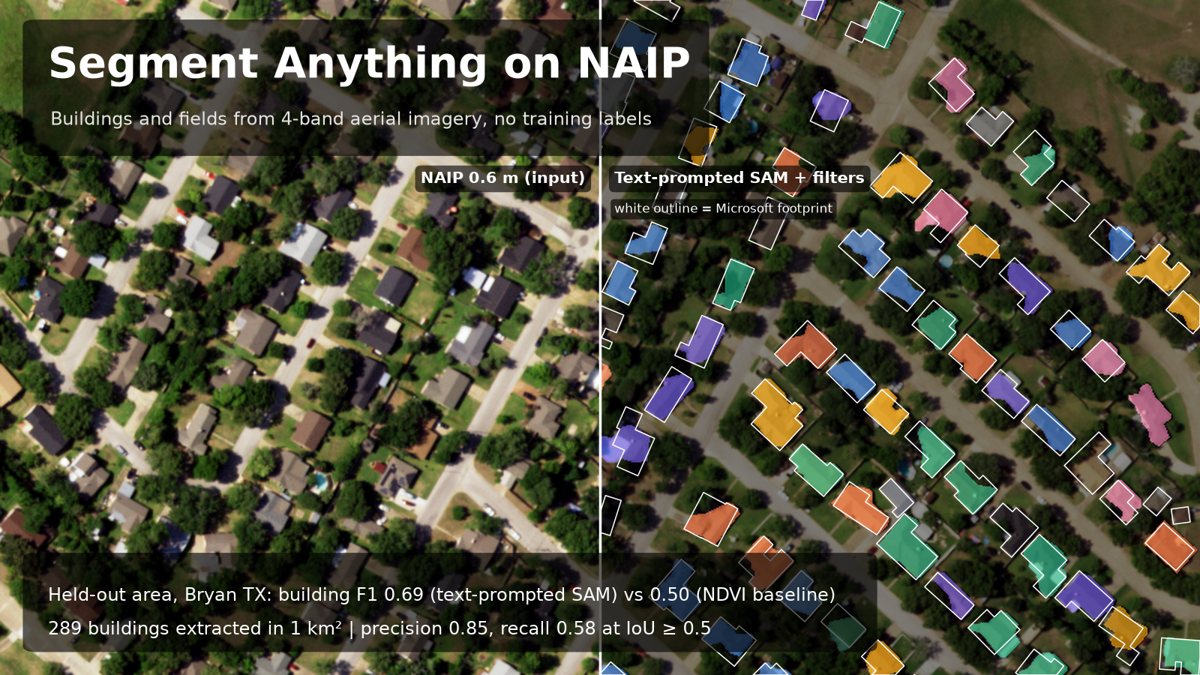
Segment Anything applied to NAIP aerial imagery: extracted building and field outlines compared with reference footprints.
Segment AnythingNAIPPyTorchfeature extraction

Segment Anything on aerial imagery

Extracting buildings and fields from 0.6 m NAIP imagery with Meta's Segment Anything Model, then scoring the outlines against reference building footprints at the object level (IoU ≥ 0.5) against a simple baseline.

On a held-out area, text-prompted SAM (Grounding DINO + SAM) reached building F1 0.69 (95% CI 0.62–0.74) against Microsoft footprints, vs 0.50 (0.42–0.57) for an NDVI/brightness baseline; it was precise (0.85) but missed about 40% of buildings.

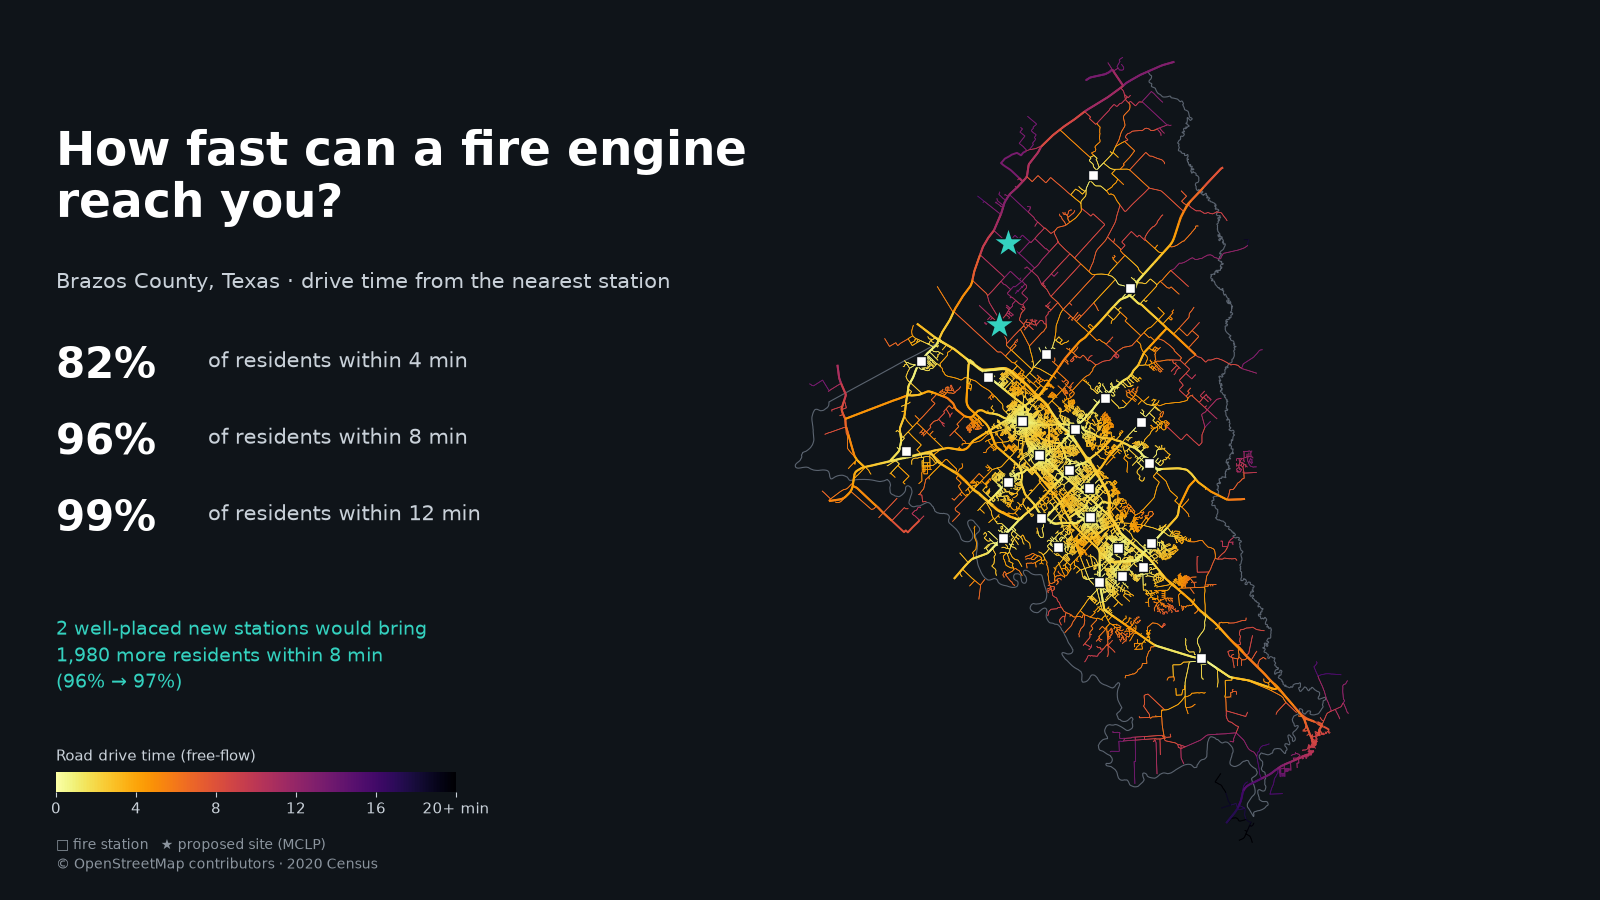
Brazos County, Texas: road drive time from the nearest fire station, with two proposed station sites from a maximal covering location model.
network analysisOSMnxlocation-allocationoptimization

How fast can a fire engine reach you?

Drive-time service areas from every fire station in Brazos County, Texas, over the OpenStreetMap road network and 2020 Census blocks, then a maximal covering location model (the open-source counterpart of Network Analyst's location-allocation) that picks where one or two new stations would cover the most residents.

82.3% of residents are within a 4-minute drive of one of 25 stations and 96.5% within 8. OpenStreetMap listed only 16 stations; adding the 9 missing ones from official department lists changed the answer, since the OSM-only "best new sites" landed about 200 m from real stations. Solver results match an exhaustive search.

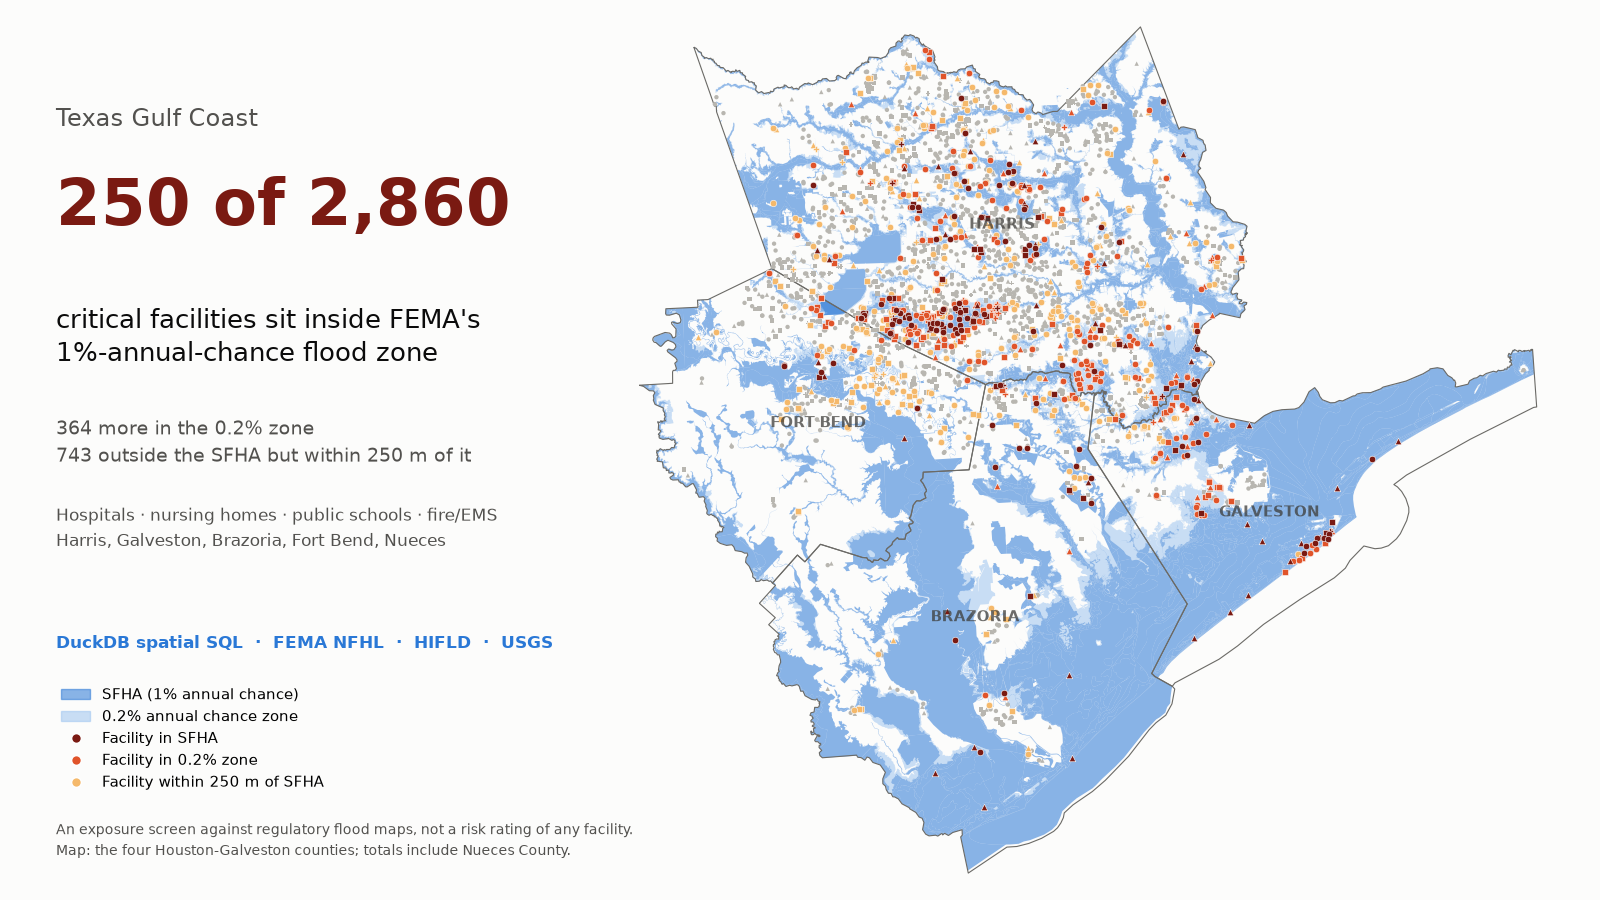
Texas Gulf Coast: critical facilities inside FEMA flood hazard zones in Harris, Galveston, Brazoria and Fort Bend counties.
spatial SQLDuckDBFEMA NFHLdata engineering

Critical facilities in Texas flood zones

A spatial-SQL pipeline (DuckDB, with PostGIS and SQL Server equivalents) that loads FEMA flood hazard maps and hospitals, nursing homes, schools and fire/EMS stations for five Gulf Coast counties, cleans them, and screens which sit in or near mapped flood zones, cross-checked against GeoPandas on every run.

250 of 2,860 facilities (8.7%) sit in FEMA's 1%-annual-chance flood zone, including 13 hospitals with 2,367 beds and 132 schools with about 90,000 students; Galveston County has the highest share (20%). Every count and distance matches an independent GeoPandas recomputation.

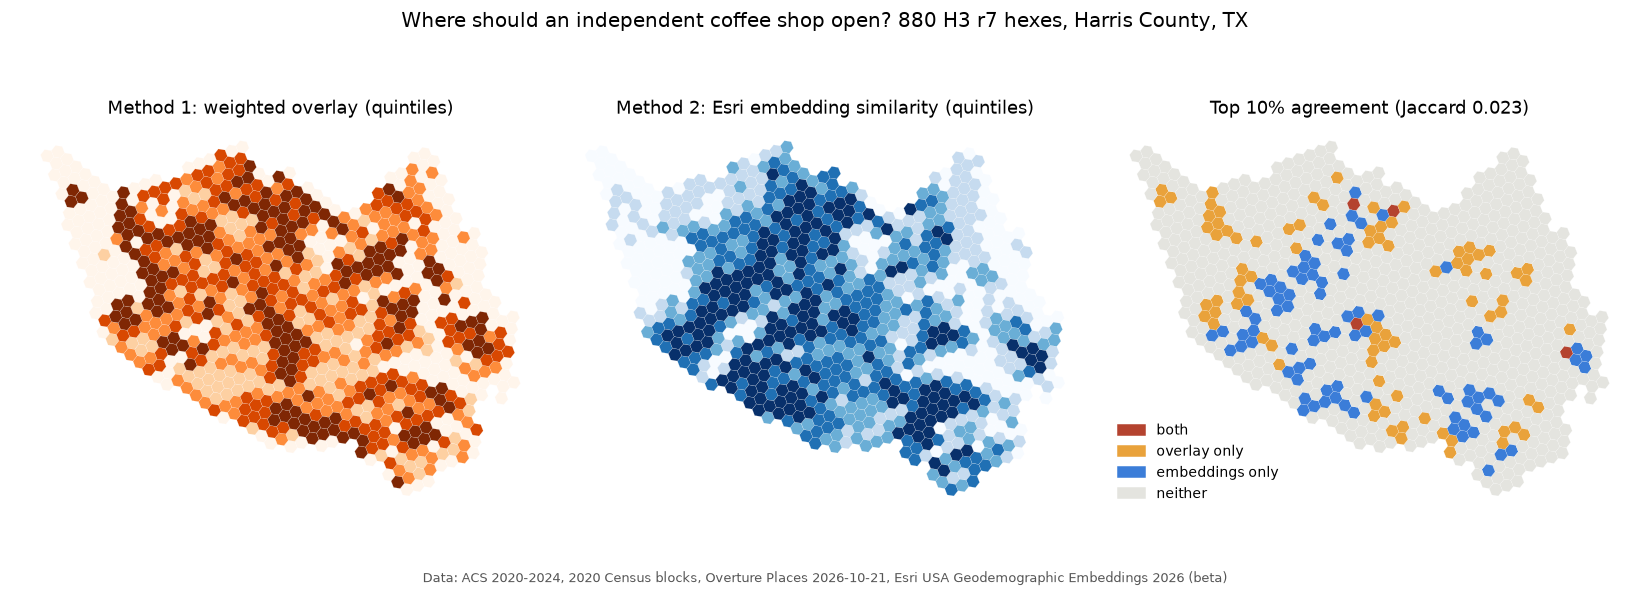
Harris County H3 hexes scored for a new independent coffee shop by an expert overlay and by Esri geodemographic embeddings, with where the two methods agree.
AI agentsMCPArcGIS Pro GeoAIembeddings

Agentic site selection: where to open a coffee shop

A manager agent and five subagents answer plain-English site questions for Harris County by calling ArcPy tools through a local MCP server, comparing an expert-weighted overlay with Esri's USA Geodemographic Embeddings (Find Similar Features Using Embeddings), and testing both on shops hidden from them. Inspired by the GeoAI demos at the 2026 Esri Energy Resources GIS Conference.

On spatially blocked hold-outs the embeddings reached AUC 0.74 and the overlay 0.71 (random 0.50), but the two methods' top 10% of hexes barely overlap (Jaccard 0.02), and in the urban core the embeddings fell to near random. A numpy re-implementation reproduces Esri's tool exactly (Spearman 1.000).

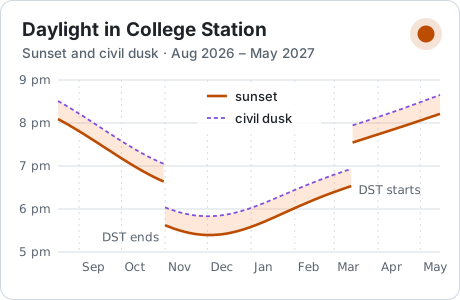
Card: sunset and civil dusk in College Station, Texas, across the academic year.
JavaScriptNOAA solar equationsteaching

Daylight in College Station

When does it get dark across the academic year? One self-contained page solves the sun's position in the browser with the NOAA solar-position equations, checked against U.S. Naval Observatory tables (within about 20 s).

Research

My M.S. research is part of a funded project led by my advisor, Dr. Leila Character. It uses drone hyperspectral imaging and machine learning to study tropical forest vegetation: from field collection, to calibrated surface reflectance with the empirical line method, to models that rank narrow bands and spectral indices. Project details, data and code stay private until the work is published.

Skills

GIS

ArcGIS Pro, ArcGIS Online, StoryMaps, QGIS, geodatabase design, spatial SQL (SQL Server), geoprocessing, cartography, linear referencing.

Remote sensing

Sentinel-2, Landsat, NAIP, hyperspectral, Google Earth Engine, ENVI (empirical line calibration), cloud masking, spectral indices, land surface temperature.

Machine learning

scikit-learn random forests and gradient boosting, spatial cross-validation, accuracy assessment and area estimation, embeddings for similarity search.

Spatial statistics

Getis-Ord Gi*, Moran's I and LISA, spatial regression, BACI designs, space-time hot spot analysis, permutation tests.

GeoAI and agents

Model Context Protocol servers, tool-using agents with local models (Ollama), retrieval with citations, verification steps that recompute answers.

Programming

Python (ArcPy, GeoPandas, rasterio, xarray, GDAL, PySAL), SQL, R, IDL, JavaScript, HTML/CSS, Git and GitHub, STAC APIs.

Data engineering

STAC catalogs and APIs, Cloud-Optimized GeoTIFFs, GeoParquet and GeoPackage, DuckDB, ISO 19115 metadata, reproducible environments.

Teaching and communication

Lab instruction for 62 students, slide decks and handouts, StoryMaps, a conference presentation (Texas A&M GIS Week 2025) and a poster accepted for AAG 2027.

Field and UAV

Hyperspectral sensor operation on UAVs, mission planning (flight lines, overlap, altitude), GPS navigation, reference-panel and launch-point surveys.

Certifications and training

What I have earned, what I am working on now, and what comes next. Certificates of completion are listed as such; none of these is a professional license unless it says so.

Earned

  • Classifying Objects Using Deep Learning in ArcGIS Pro certificateEsri TrainingNov 2025
  • Introduction to Image Classification certificateEsri TrainingOct 2025
  • Displaying Raster Data in ArcGIS certificateEsri TrainingOct 2025
  • Responsible Conduct of Research completedCITI Program, Texas A&M University2026

In progress

  • FAA Part 107 Remote Pilot Certificate test scheduledFederal Aviation Administration · small unmanned aircraftFall 2026
  • Spatial Data Science MOOC in progressEsriFall 2026
  • GRAD Aggies Foundations Certificate in progressTexas A&M Graduate and Professional School · six professional development sessionsFall 2026

Next

  • ARSET Fundamentals of Remote Sensing plannedNASA Applied Remote Sensing Training · certificate of completionNov 2026
  • ARSET Hyperspectral Data for Land and Coastal Systems plannedNASA Applied Remote Sensing Training · certificate of completionDec 2026
  • Introduction to Model Context Protocol plannedAnthropic Academy · certificate of completionWinter 2026
  • MCP Course plannedHugging Face · fundamentals certificateWinter 2026
  • NASA Open Science 101 plannedNASA Transform to Open Science · badge and certificateSpring 2027

Conferences and workshops

  • Esri User Conference, San DiegoImagery and Remote Sensing SIG; metadata and CAD training; Gaussian-splat digital twins; department volunteerJul 2026
  • Esri Energy conference, HoustonGeoAI applications in the energy industryMay 2026

Experience

Aug 2026 – now

Graduate Researcher, hyperspectral remote sensing

Department of Geography, Texas A&M. Calibrating drone hyperspectral imagery to surface reflectance; preparing random-forest models for tree-species separation.

Aug 2026 – now

Graduate Teaching Assistant, Geodatabases (GEOG 391/659)

Three lab sections, 62 students: geodatabase design, ER modeling, normalization, SQL Server, spatial SQL and ArcGIS Pro.

Fall 2026

Team Lead, Pipelines from Space

Eight-person statewide study of vegetation along Texas pipelines with Sentinel-2, Landsat, NAIP and NLCD.

May – Jun 2026

Field Assistant, hyperspectral sensor operator

Planned UAV hyperspectral missions, scripted sensor acquisition programs, operated the sensor and served as visual observer in tropical forest.

Aug – Dec 2025

Undergraduate Research Team Leader

Five-person study of pipelines, vegetation and soil moisture in Texas with Google Earth Engine and ArcGIS Pro; presented at Texas A&M GIS Week.

Mar 2024 – Aug 2026

Student Technician I, TEEX

Maintained liquid, gas and water pipelines (0.25–12 in), facility inspections under safety protocols, field data collection.

Contact

Open to GIS and remote sensing internships for summer 2027.